 ["graphviz", "images/sample1.png"]
 ---------------------------------------------------------------------
 digraph G { rankdir=LR; Graphviz->AsciiDoc->HTML}
 ---------------------------------------------------------------------
「百聞は一見にしかず」なので、 まずはごらんあれ。
簡単な例
論理的なつながりを表現するだけです。
これが、次のように描画されます。

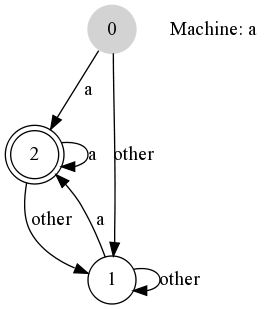
状態遷移図
次のURLにはとても参考になるGraphvizのサンプルがあります。
- GraphViz Text-to-Flowchart Examples
-
http://flickr.com/photos/kentbye/sets/72157601523153827/detail/
Graphvizでは図の大きさや色なども指定することができます。
 ["graphviz", "images/sample2.png"]
 ---------------------------------------------------------------------
 digraph automata_0 {
    size ="8.5, 11";
    node [shape = circle];
    0 [ style = filled, color=lightgrey ];
    2 [ shape = doublecircle ];
    0 -> 2 [ label = "a " ];
    0 -> 1 [ label = "other " ];
    1 -> 2 [ label = "a " ];
    1 -> 1 [ label = "other " ];
    2 -> 2 [ label = "a " ];
    2 -> 1 [ label = "other " ];
    "Machine: a" [ shape = plaintext ];
 }
 ---------------------------------------------------------------------
これは次の状態遷移図となります。
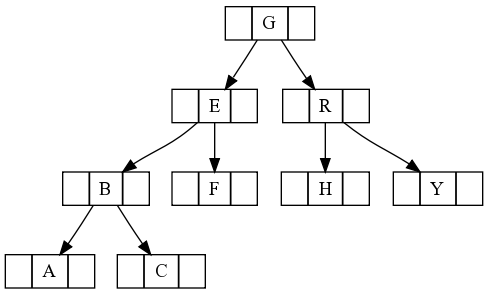
データツリー
基本的には状態遷移図と同じですが、 データツリーの表現することも簡単です。
 ["graphviz", "images/sample3.png"]
 ---------------------------------------------------------------------
 digraph g {
 node [shape = record,height=.1];
 node0[label = " | G| "];
 node1[label = " | E| "];
 node2[label = " | B| "];
 node3[label = " | F| "];
 node4[label = " | R| "];
 node5[label = " | H| "];
 node6[label = " | Y| "];
 node7[label = " | A| "];
 node8[label = " | C| "];
 "node0":f2 -> "node4":f1;
 "node0":f0 -> "node1":f1;
 "node1":f0 -> "node2":f1;
 "node1":f2 -> "node3":f1;
 "node2":f2 -> "node8":f1;
 "node2":f0 -> "node7":f1;
 "node4":f2 -> "node6":f1;
 "node4":f0 -> "node5":f1;
 }
 ---------------------------------------------------------------------
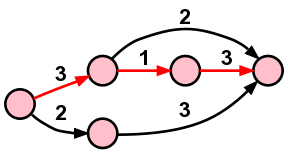
クリティカルパス
["graphviz", "images/sample4.png"]
 ---------------------------------------------------------------------
 digraph G {
    node [ fontname="Helvetica-Bold", shape="circle", width="0.3",
        style ="setlinewidth(2),filled" color="black",
        fillcolor = "pink", label=""];
    edge [ fontname="Helvetica-Bold", fontsize="16", style="bold" ];
    graph [ rankdir="LR", ranksep="0.4"];
    { rank = same;  B; D;}

    A -> B [ label = "3", color="red"];
    B -> C [ label = "2"];
    B -> E [ label = "1", color="red"];
    E -> C [ label = "3", color="red"];
    A -> D [ label = "2"];
    D -> C [ label = "3"];
 }
 ---------------------------------------------------------------------
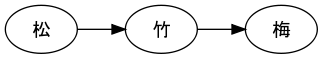
日本語
日本語も大丈夫です。
フォントの指示でTrueTypeの日本語フォントを指示するために、 フォントファイルを記述します。
Graphvizの古いバージョンではハイフォン(-)が フォント名にあると失敗するとの報告もあるようです。
 ["graphviz", "images/sample5.png"]
 ---------------------------------------------------------------------
 digraph G {
    fontname="VL-Gothic-Regular";
    rankdir=LR; 松->竹->梅
 }
 ---------------------------------------------------------------------
これが、次のように描画されます。